Ungraded Lab: TFDV Exercise

In this notebook, you will get to practice using TensorFlow Data Validation (TFDV), an open-source Python package from the TensorFlow Extended (TFX) ecosystem.

TFDV helps to understand, validate, and monitor production machine learning data at scale. It provides insight into some key questions in the data analysis process such as:

The figure below summarizes the usual TFDV workflow:
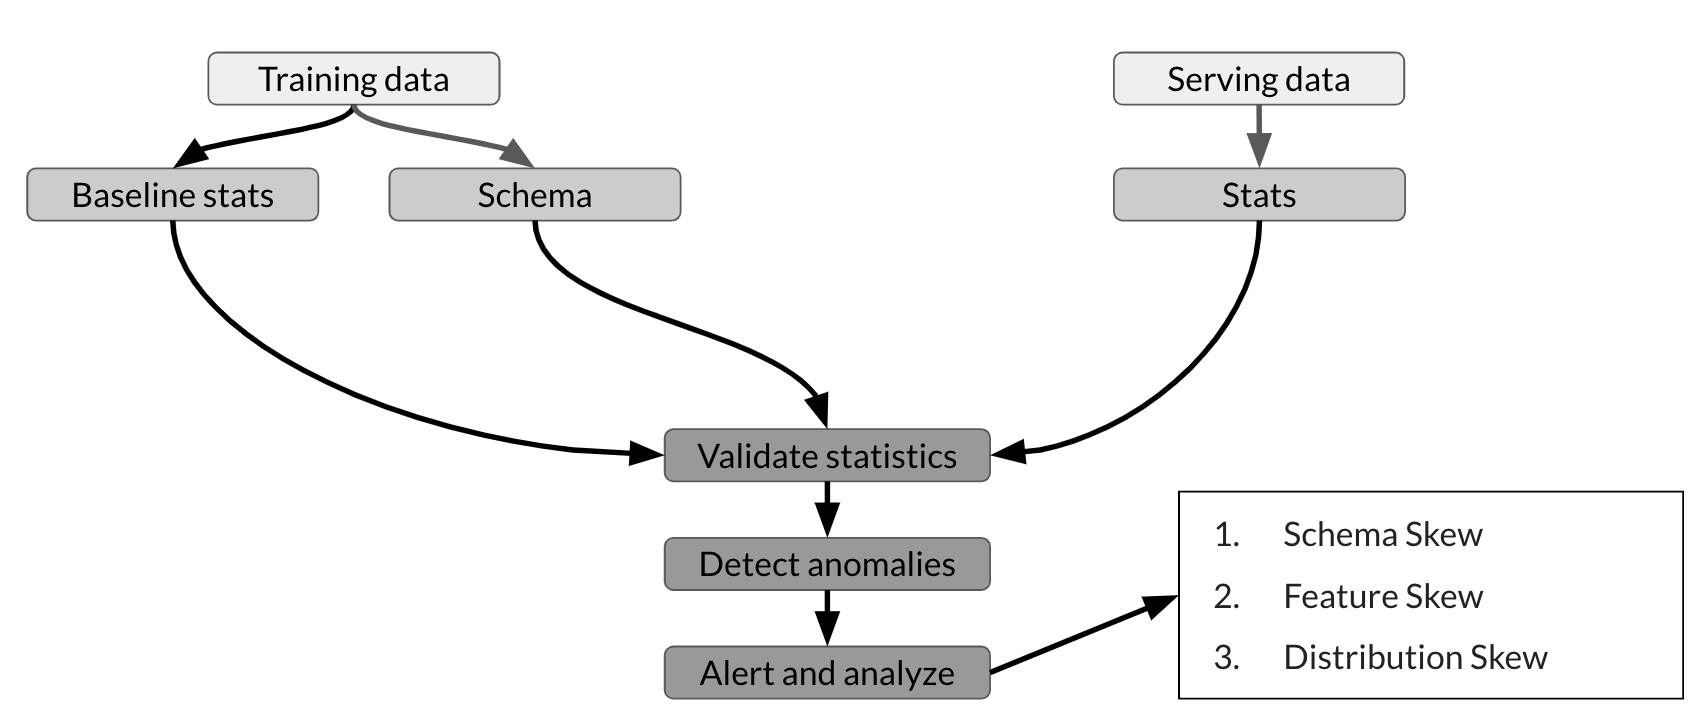
picture of tfdv workflow

As shown, you can use TFDV to compute descriptive statistics of the training data and generate a schema. You can then validate new datasets (e.g. the serving dataset from your customers) against this schema to detect and fix anomalies. This helps prevent the different types of skew. That way, you can be confident that your model is training on or predicting data that is consistent with the expected feature types and distribution.

This ungraded exercise demonstrates useful functions of TFDV at an introductory level as preparation for this week's graded programming exercise. Specifically, you will:

Let's begin!

Package Installation and Imports

Download the dataset

You will be working with the Census Income Dataset, a dataset that can be used to predict if an individual earns more than or less than 50k US Dollars annually. The summary of attribute names with descriptions/expected values is shown below and you can read more about it in this data description file.

Let's load the dataset and split it into training and evaluation sets. We will not shuffle them for consistent results in this demo notebook but you should otherwise in real projects.

Let's see the first few columns of the train and eval sets.

From these few columns, you can get a first impression of the data. You will notice that most are strings and integers. There are also columns that are mostly zeroes. In the next sections, you will see how to use TFDV to aggregate and process this information so you can inspect it more easily.

Adding extra rows

To demonstrate how TFDV can detect anomalies later, you will add a few extra rows to the evaluation dataset. These are either malformed or have values that will trigger certain alarms later in this notebook. The code to add these can be seen in the add_extra_rows() function of util.py found in your Jupyter workspace. You can look at it later and even modify it after you've completed the entire exercise. For now, let's just execute the function and add the rows that we've defined by default.

Generate and visualize training dataset statistics

You can now compute and visualize the statistics of your training dataset. TFDV accepts three input formats: TensorFlow’s TFRecord, Pandas Dataframe, and CSV file. In this exercise, you will feed in the Pandas Dataframes you generated from the train-test split.

You can compute your dataset statistics by using the generate_statistics_from_dataframe() method. Under the hood, it distributes the analysis via Apache Beam which allows it to scale over large datasets.

The results returned by this step for numerical and categorical data are summarized in this table:

Numerical Data Categorical Data
Count of data records Count of data records
% of missing data records % of missing data records
Mean, std, min, max unique records
% of zero values Avg string length

Once you've generated the statistics, you can easily visualize your results with the visualize_statistics() method. This shows a Facets interface and is very useful to spot if you have a high amount of missing data or high standard deviation. Run the cell below and explore the different settings in the output interface (e.g. Sort by, Reverse order, Feature search).

Infer data schema

Next step is to create a data schema to describe your train set. Simply put, a schema describes standard characteristics of your data such as column data types and expected data value range. The schema is created on a dataset that you consider as reference, and can be reused to validate other incoming datasets.

With the computed statistics, TFDV allows you to automatically generate an initial version of the schema using the infer_schema() method. This returns a Schema protocol buffer containing the result. As mentioned in the TFX paper (Section 3.3), the results of the schema inference can be summarized as follows:

Run the cell below to infer the training dataset schema.

Generate and visualize evaluation dataset statistics

The next step after generating the schema is to now look at the evaluation dataset. You will begin by computing its statistics then compare it with the training statistics. It is important that the numerical and categorical features of the evaluation data belongs roughly to the same range as the training data. Otherwise, you might have distribution skew that will negatively affect the accuracy of your model.

TFDV allows you to generate both the training and evaluation dataset statistics side-by-side. You can use the visualize_statistics() function and pass additional parameters to overlay the statistics from both datasets (referenced as left-hand side and right-hand side statistics). Let's see what these parameters are:

We encourage you to observe the results generated and toggle the menus to practice manipulating the visualization (e.g. sort by missing/zeroes). You'll notice that TFDV detects the malformed rows we introduced earlier. First, the min and max values of the age row shows 0 and 1000, respectively. We know that those values do not make sense if we're talking about working adults. Secondly, the workclass row in the Categorical Features says that 0.02% of the data is missing that particular attribute. Let's drop these rows to make the data more clean.

You can then compute the statistics again and see the difference in the results.

Calculate and display evaluation anomalies

You can use your reference schema to check for anomalies such as new values for a specific feature in the evaluation data. Detected anomalies can either be considered a real error that needs to be cleaned, or depending on your domain knowledge and the specific case, they can be accepted.

Let's detect and display evaluation anomalies and see if there are any problems that need to be addressed.

Revising the Schema

As shown in the results above, TFDV is able to detect the remaining irregularities we introduced earlier. The short and long descriptions tell us what were detected. As expected, there are string values for race, native-country and occupation that are not found in the domain of the training set schema (you might see a different result if the shuffling of the datasets was applied). What you decide to do about the anomalies depend on your domain knowledge of the data. If an anomaly indicates a data error, then the underlying data should be fixed. Otherwise, you can update the schema to include the values in the evaluation dataset.

TFDV provides a set of utility methods and parameters that you can use for revising the inferred schema. This reference lists down the type of anomalies and the parameters that you can edit but we'll focus only on a couple here.

tfdv.get_feature(schema, 'feature_column_name').distribution_constraints.min_domain_mass = <float: 0.0 to 1.0>
tfdv.get_domain(schema, 'feature_column_name').value.append('string')

Let's use these in the next section.

Fix anomalies in the schema

Let's say that we want to accept the string anomalies reported as valid. If you want to tolerate a fraction of missing values from the evaluation dataset, you can do it like this:

If you want to be rigid and instead add only valid values to the domain, you can do it like this:

In addition, you can also restrict the range of a numerical feature. This will let you know of invalid values without having to inspect it visually (e.g. the invalid age values earlier).

With these revisions, running the validation should now show no anomalies.

Examining dataset slices

TFDV also allows you to analyze specific slices of your dataset. This is particularly useful if you want to inspect if a feature type is well-represented in your dataset. Let's walk through an example where we want to compare the statistics for male and female participants.

First, you will use the get_feature_value_slicer method from the slicing_util to get the features you want to examine. You can specify that by passing a dictionary to the features argument. If you want to get the entire domain of a feature, then you can map the feature name with None as shown below. This means that you will get slices for both Male and Female entries. This returns a function that can be used to extract the said feature slice.

With the slice function ready, you can now generate the statistics. You need to tell TFDV that you need statistics for the features you set and you can do that through the slice_functions argument of tfdv.StatsOptions. Let's prepare that in the cell below. Notice that you also need to pass in the schema.

You will then pass these options to the generate_statistics_from_csv() method. As of writing, generating sliced statistics only works for CSVs so you will need to convert the Pandas dataframe to a CSV. Passing the slice_stats_options to generate_statistics_from_dataframe() will not produce the expected results.

With that, you now have the statistics for the set slice. These are packed into a DatasetFeatureStatisticsList protocol buffer. You can see the dataset names below. The first element in the list (i.e. index=0) is named All_Examples which just contains the statistics for the entire dataset. The next two elements (i.e. named sex_Male and sex_Female) are the datasets that contain the stats for the slices. It is important to note that these datasets are of the type: DatasetFeatureStatistics. You will see why this is important after the cell below.

You can then visualize the statistics as before to examine the slices. An important caveat is visualize_statistics() accepts a DatasetFeatureStatisticsList type instead of DatasetFeatureStatistics. Thus, at least for this version of TFDV, you will need to convert it to the correct type.

You should now see the visualization of the two slices and you can compare how they are represented in the dataset.

We encourage you to go back to the beginning of this section and try different slices. Here are other ways you can explore:

You might find it cumbersome or inefficient to redo the whole process for a particular slice. For that, you can make helper functions to streamline the type conversions and you will see one implementation in this week's assignment.

Wrap up

This exercise demonstrated how you would use Tensorflow Data Validation in a machine learning project.

You can consult this notebook in this week's programming assignment as well as these additional resources: